
Bonavista Downs: 3 homes for sale ($689,900–$825,000), 7 detached sales in the last 90 days, median $610,000. Updated Oct 24, 2026.
Bonavista Downs Calgary Real Estate | Home Prices, Sales & Listings
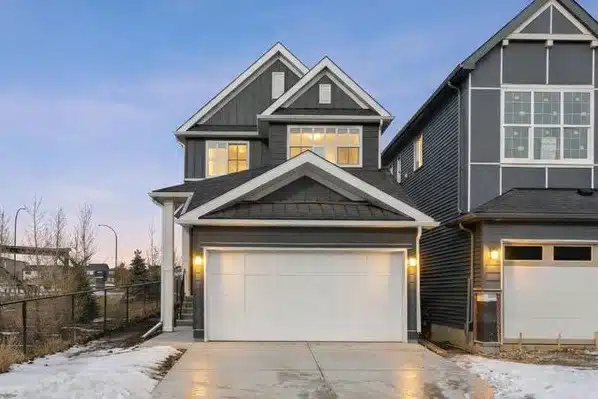
Bonavista Downs Calgary real estate features single-family homes built primarily in the 1970s in Calgary’s established southeast. The community sits adjacent to Lake Bonavista and benefits from proximity to that community’s amenities and lifestyle appeal without the lake access premium. Buyers here find solid mid-range value, mature lots and a quiet residential character that appeals to families and long-term owner-occupants.
*The Charts below are exclusively created by Jerry Charlton – Calgary Realtor Since 2002
Homes for Sale in Bonavista Downs, Calgary
There are currently 3 homes for sale in Bonavista Downs, priced from $689,900 to $825,000. Figures below come from MLS® sales in the last 90 days, updated Oct 24, 2026.
| Property type | For sale | Asking price range | Sold (90 days) | Median sold | $/sq ft | Days on market |
|---|---|---|---|---|---|---|
| Detached | 3 | $689,900 – $825,000 | 7 | $610,000 | $564 | 44 |
| Townhouse | 0 | — | 0 | No sales | — | — |
| Apartment / condo | 0 | — | 0 | No sales | — | — |
Bonavista Downs Detached Market
3 detached homes are for sale in Bonavista Downs between $689,900 and $825,000. Over the last 90 days 7 sold, from $535,532 to $683,500, median $610,000, averaging $564 per square foot and 44 days on market. Sellers achieved 98.9% of list price.
| Status | Address | Bed | Bath | Sq ft | Price | $/sq ft | Days |
|---|---|---|---|---|---|---|---|
| Sold Aug 19 | 43 Lake Sylvan Close SE 4 Level Split | 4 | 3 | 1,194 | $535,532 | $449 | 12 |
| Sold Aug 13 | 1288 Lake Sylvan Drive SE Bungalow | 3 | 2 | 1,040 | $560,000 | $538 | 64 |
| Sold Jul 31 | 7 Lake Sylvan Close SE Bungalow | 4 | 2 | 1,180 | $600,000 | $508 | 12 |
| Sold Oct 14 | 163 Lake Sylvan Close SE Bungalow | 4 | 2 | 1,034 | $610,000 | $590 | 42 |
| Sold Sep 30 | 1376 Lake Sylvan Drive SE Bungalow | 4 | 3 | 1,156 | $647,000 | $560 | 74 |
| Sold Sep 14 | 170 Lake Sylvan Close SE Bi-Level | 4 | 2 | 950 | $680,000 | $715 | 95 |
| Sold Oct 4 | 5 Lake Huron Bay SE Bungalow | 4 | 2 | 1,168 | $683,500 | $585 | 9 |
| For sale | 12164 Lake Michigan Road SE Bi-Level | 3 | 2 | 975 | $689,900 | $708 | 31 |
| For sale | 1212 Lake Sylvan Drive SE Bungalow | 5 | 3 | 1,197 | $690,000 | $576 | 81 |
| For sale | 1204 Lake Sylvan Drive SE 4 Level Split | 4 | 3 | 1,134 | $825,000 | $728 | 20 |
Age of Homes in Bonavista Downs
- Avg year built
- 1973
- Avg age
- 53 yrs
- Most homes built
- 1972–1977
- Most common style
- Bungalow (63%)
Most of the 314 detached homes in Bonavista Downs were built between 1972 and 1977. The average year built is 1973, about 53 years old. It ranks 88 of 202 Calgary communities from oldest to newest. Bungalows are the most common style at 63%, with only 2% 2 storey.
See how every Calgary community compares by age of homes →
2021 Census: City of Calgary Community Profile – Bonavista Downs
- Owner-occupied homes
- 83%Calgary 69%
- Median household income
- $93,000Calgary $98,000
- People per household
- 2.4Calgary 2.6
- Residents under 15 · 65+
- 13% · 18%Calgary 18% · 13%
In the 2021 Census, 83% of the 350 households in Bonavista Downs owned their home, compared with 69% across Calgary. The median household income was $93,000, below the city-wide $98,000. Households are smaller than average, at 2.4 people per household, and 20% are one person living alone (Calgary: 2.6 and 26%). Household income counts everyone in the home, so household size matters when comparing. 13% of residents were under 15 and 18% were 65 or older (Calgary: 18% and 13%).
See the full Bonavista Downs community profile from the City of Calgary →
View all active Bonavista Downs listings & photos on JerryCharlton.com →
Market data updated Oct 24, 2026 · Jerry Charlton, eXp Realty · 403 831 0842
Bonavista Downs Calgary Active, Pending & Recently Sold Detached Homes
With Fair Market Value Trend Line and Fair Market Value Price Range

This scatter chart plots active listings, pending sales, and the most recent sold homes by both price and home size. By looking at recent sales we can estimate the current fair value range for homes in Bonavista Downs.
The purple trend line shows the approximate relationship between home size and market value, while the shaded band represents a typical ±10% fair value range based on the most recent sales.
Homes priced above the band are typically premium properties, often fully renovated or located on larger redevelopment lots. Homes below the band may represent value opportunities for buyers willing to renovate or update.
Bonavista Downs Home Price History

This long-term chart shows how detached home prices in Bonavista Downs have evolved over time. Each point represents an individual home sale plotted by its sale date and price.
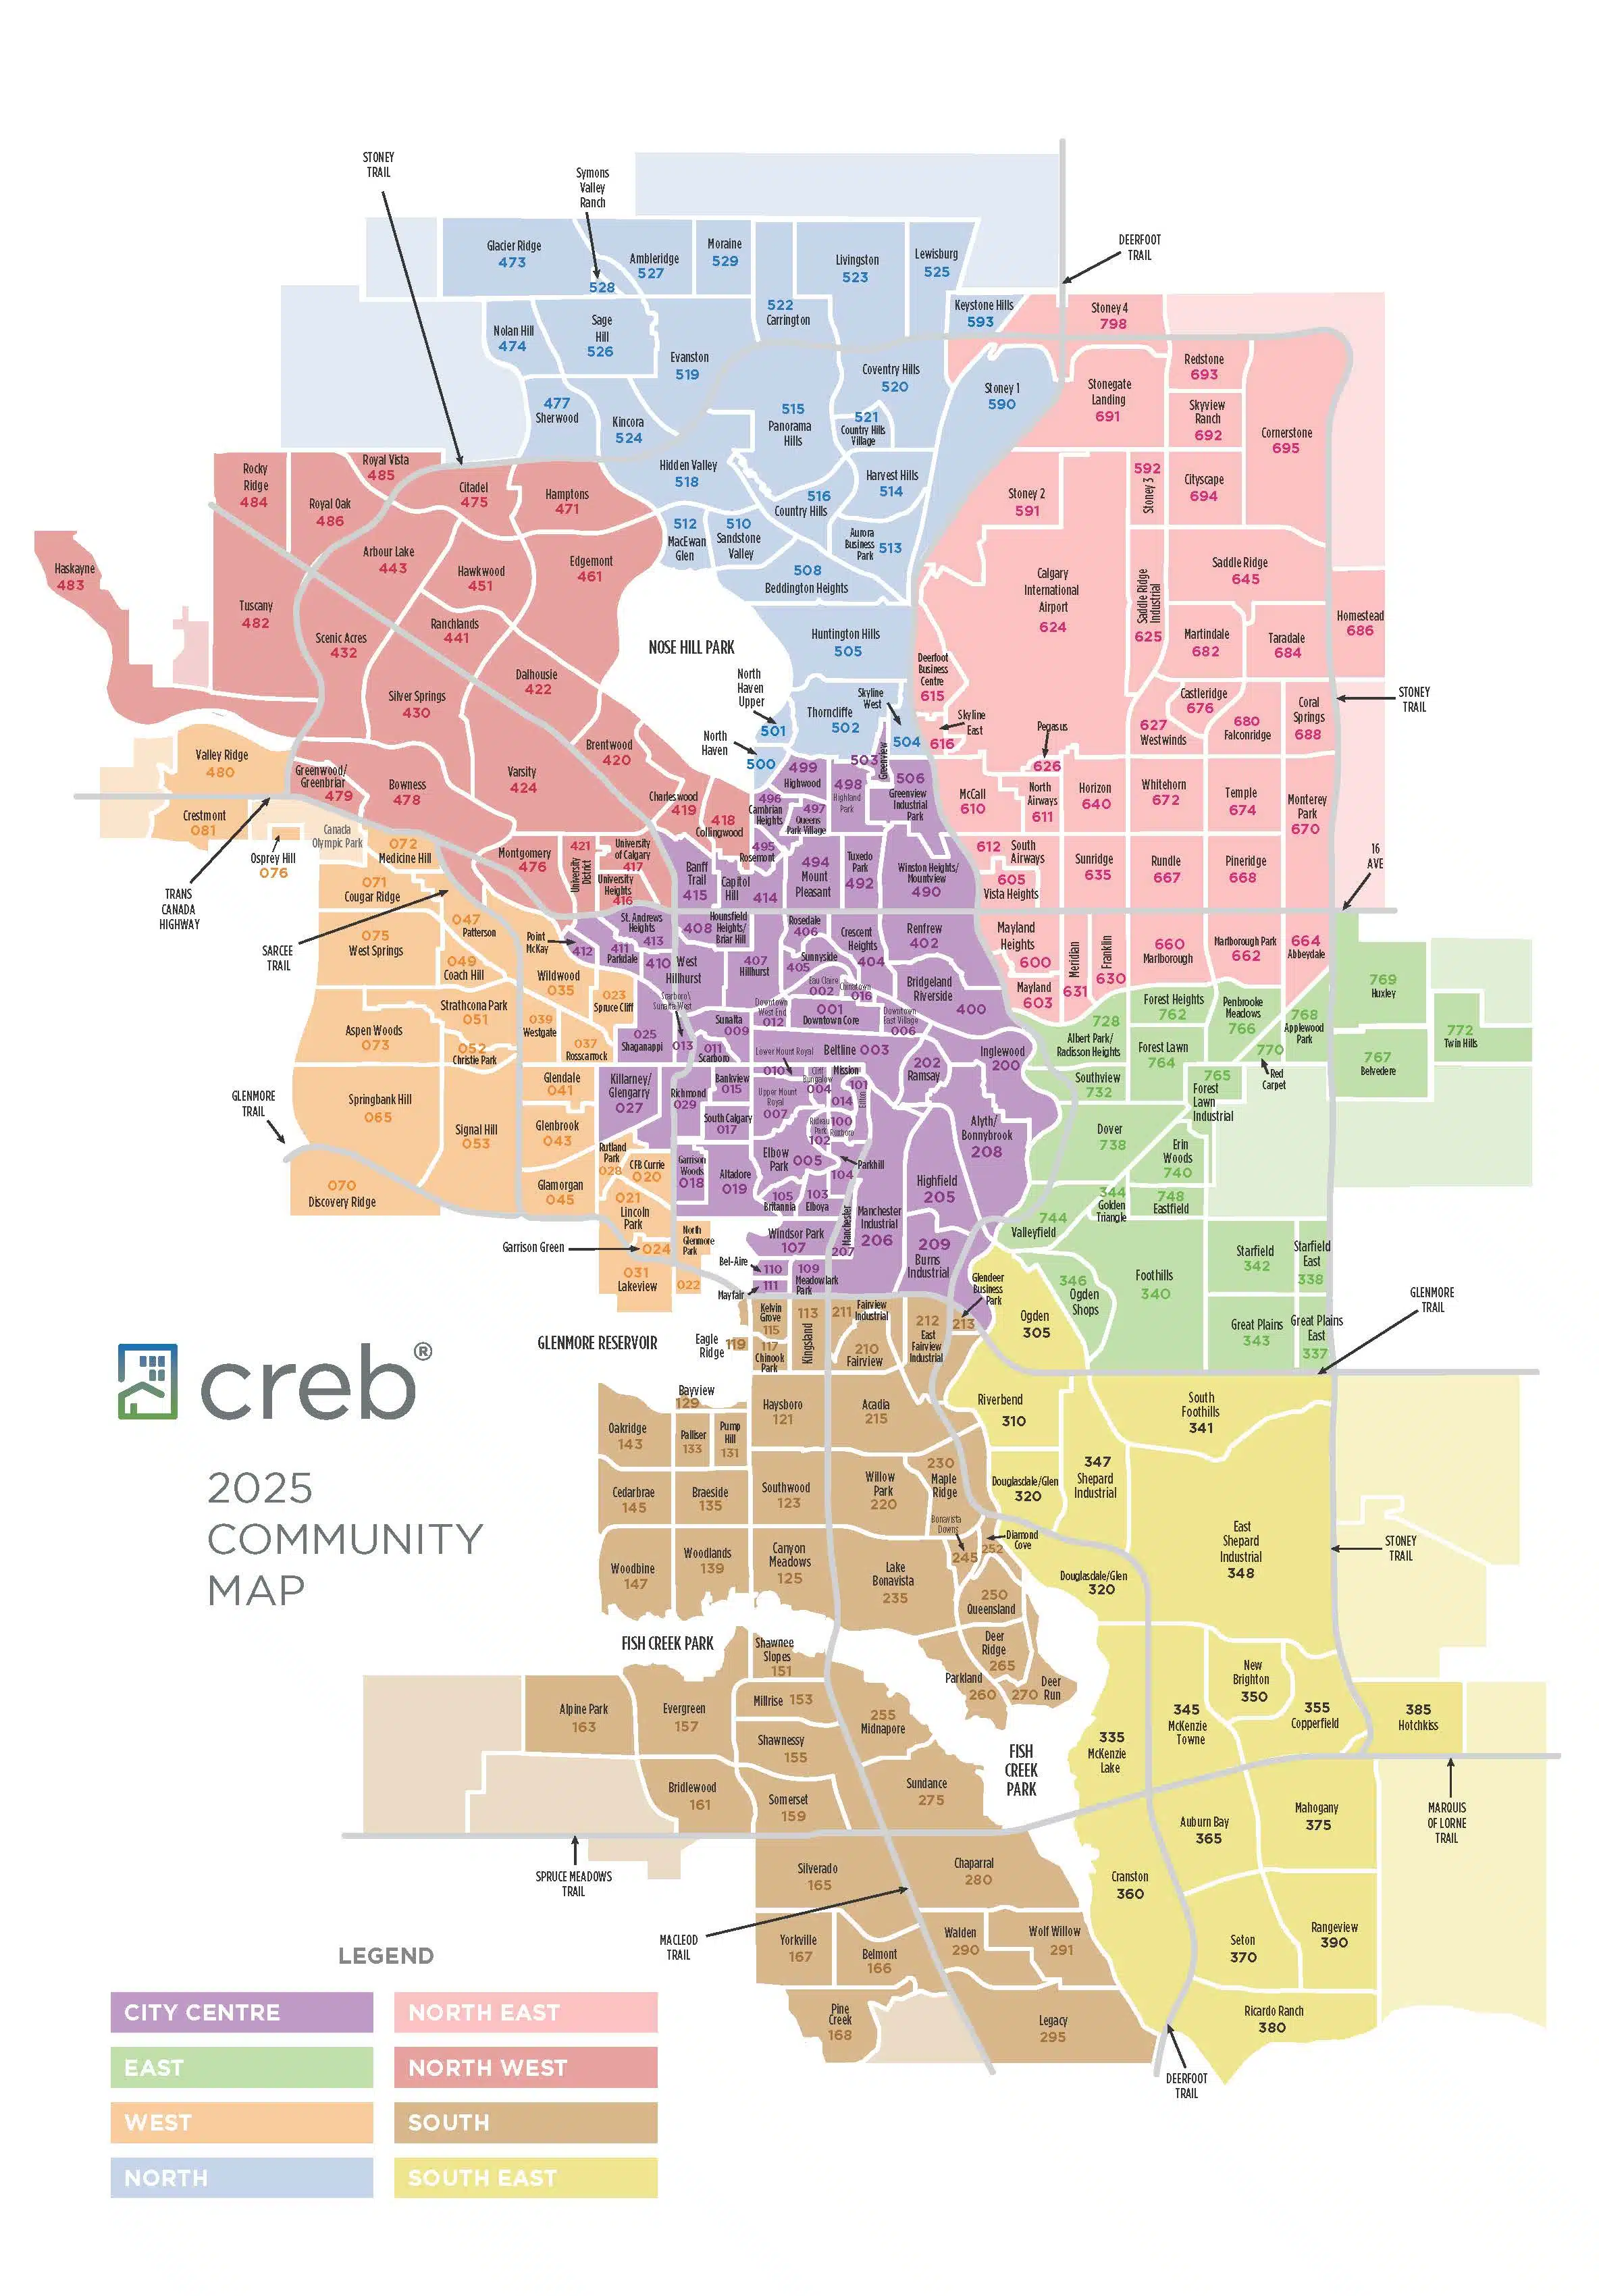
Calgary Community Map — Where is Bonavista Downs?
See where Bonavista Downs sits within Calgary and explore surrounding communities. Click the map to view full size.
Current Homes for Sale in Bonavista Downs
The listings below show homes currently available in Bonavista Downs. Comparing these listings to recent sales and historical trends can help buyers understand where each property sits within the broader market.