Applewood Park Calgary Real Estate | Home Prices, Sales & Listings
Applewood Park: 15 homes for sale ($137,000–$709,999), 6 detached sales in the last 90 days, median $519,750. Updated Nov 22, 2026.
In the last 12 months, 40 homes sold in Applewood Park at a median price of $482,000. 15 are for sale now: 4.5 months of supply, a buyer's market.
Last 12 months
Line: median sold price each month (months with fewer than 3 sales left out). Bars: homes sold. Nov is this month so far.
By home type
Click a row to drill in.| Home type | Sold | Median price | $/sq ft | Days to sell | For sale | Months of supply |
|---|---|---|---|---|---|---|
| 26 | $548,500 | $404 | 28 | 12 | 5.5 | |
| 1 | $368,000 | $277 | 34 | 0 | 0.0 | |
| 13 | $160,000 | $309 | 57 | 3 | 2.8 | |
| All | 40 | $482,000 | $371 | 30 | 15 | 4.5 |
By price range
Click a row to drill in.| Price | Sold | Median price | $/sq ft | Days to sell | For sale | Months of supply |
|---|---|---|---|---|---|---|
| 13 | $160,000 | $309 | 57 | 3 | 2.8 | |
| 2 | $359,000 | $234 | 42 | 0 | 0.0 | |
| 7 | $465,000 | $444 | 22 | 2 | 3.4 | |
| 13 | $560,000 | $397 | 29 | 8 | 7.4 | |
| 5 | $630,000 | $408 | 25 | 1 | 2.4 | |
| 0 | – | – | – | 1 | – | |
| All | 40 | $482,000 | $371 | 30 | 15 | 4.5 |
Sold homes count at their sold price, homes for sale at their asking price. Months of supply: homes for sale now ÷ homes sold per month over the last 12 months; under 3 is a seller's market, over 4 a buyer's market. Grey numbers: fewer than 3 sales.
Sales and listings from the Pillar 9™ MLS® System, updated November 22, 2026. Every home sold in the last 12 months and every home for sale tonight; no addresses are shown.
About Applewood Park

Applewood Park Calgary real estate offers predominantly single-family homes built in the 1990s in Calgary’s established northeast. The community provides mid-range pricing with good access to Stoney Trail and is a practical choice for families and investors seeking value in a mature neighbourhood with established schools and amenities. Lot sizes are generous and the housing stock is well maintained, with ongoing renovation activity lifting values across the community.
Age of homes in Applewood Park
Most of the 1,194 detached homes in Applewood Park were built between 1982 and 1998. The average year built is 1993, about 33 years old. It ranks 132 of 202 Calgary communities from oldest to newest. 2 storey homes are the most common style at 35%, and 12% are bungalows.
2021 Census: who lives in Applewood Park
In the 2021 Census, 61% of the 2,300 households in Applewood Park owned their home, compared with 69% across Calgary. The median household income was $87,000, below the city-wide $98,000. Households are larger than average, at 3.0 people per household, and 23% are one person living alone (Calgary: 2.6 and 26%). Household income counts everyone in the home, so household size matters when comparing. 17% of residents were under 15 and 11% were 65 or older (Calgary: 18% and 13%).
The full Applewood Park community profile from the City of Calgary →
Applewood Park Calgary Active, Pending & Recently Sold Detached Homes
With Fair Market Value Trend Line and Fair Market Value Price Range
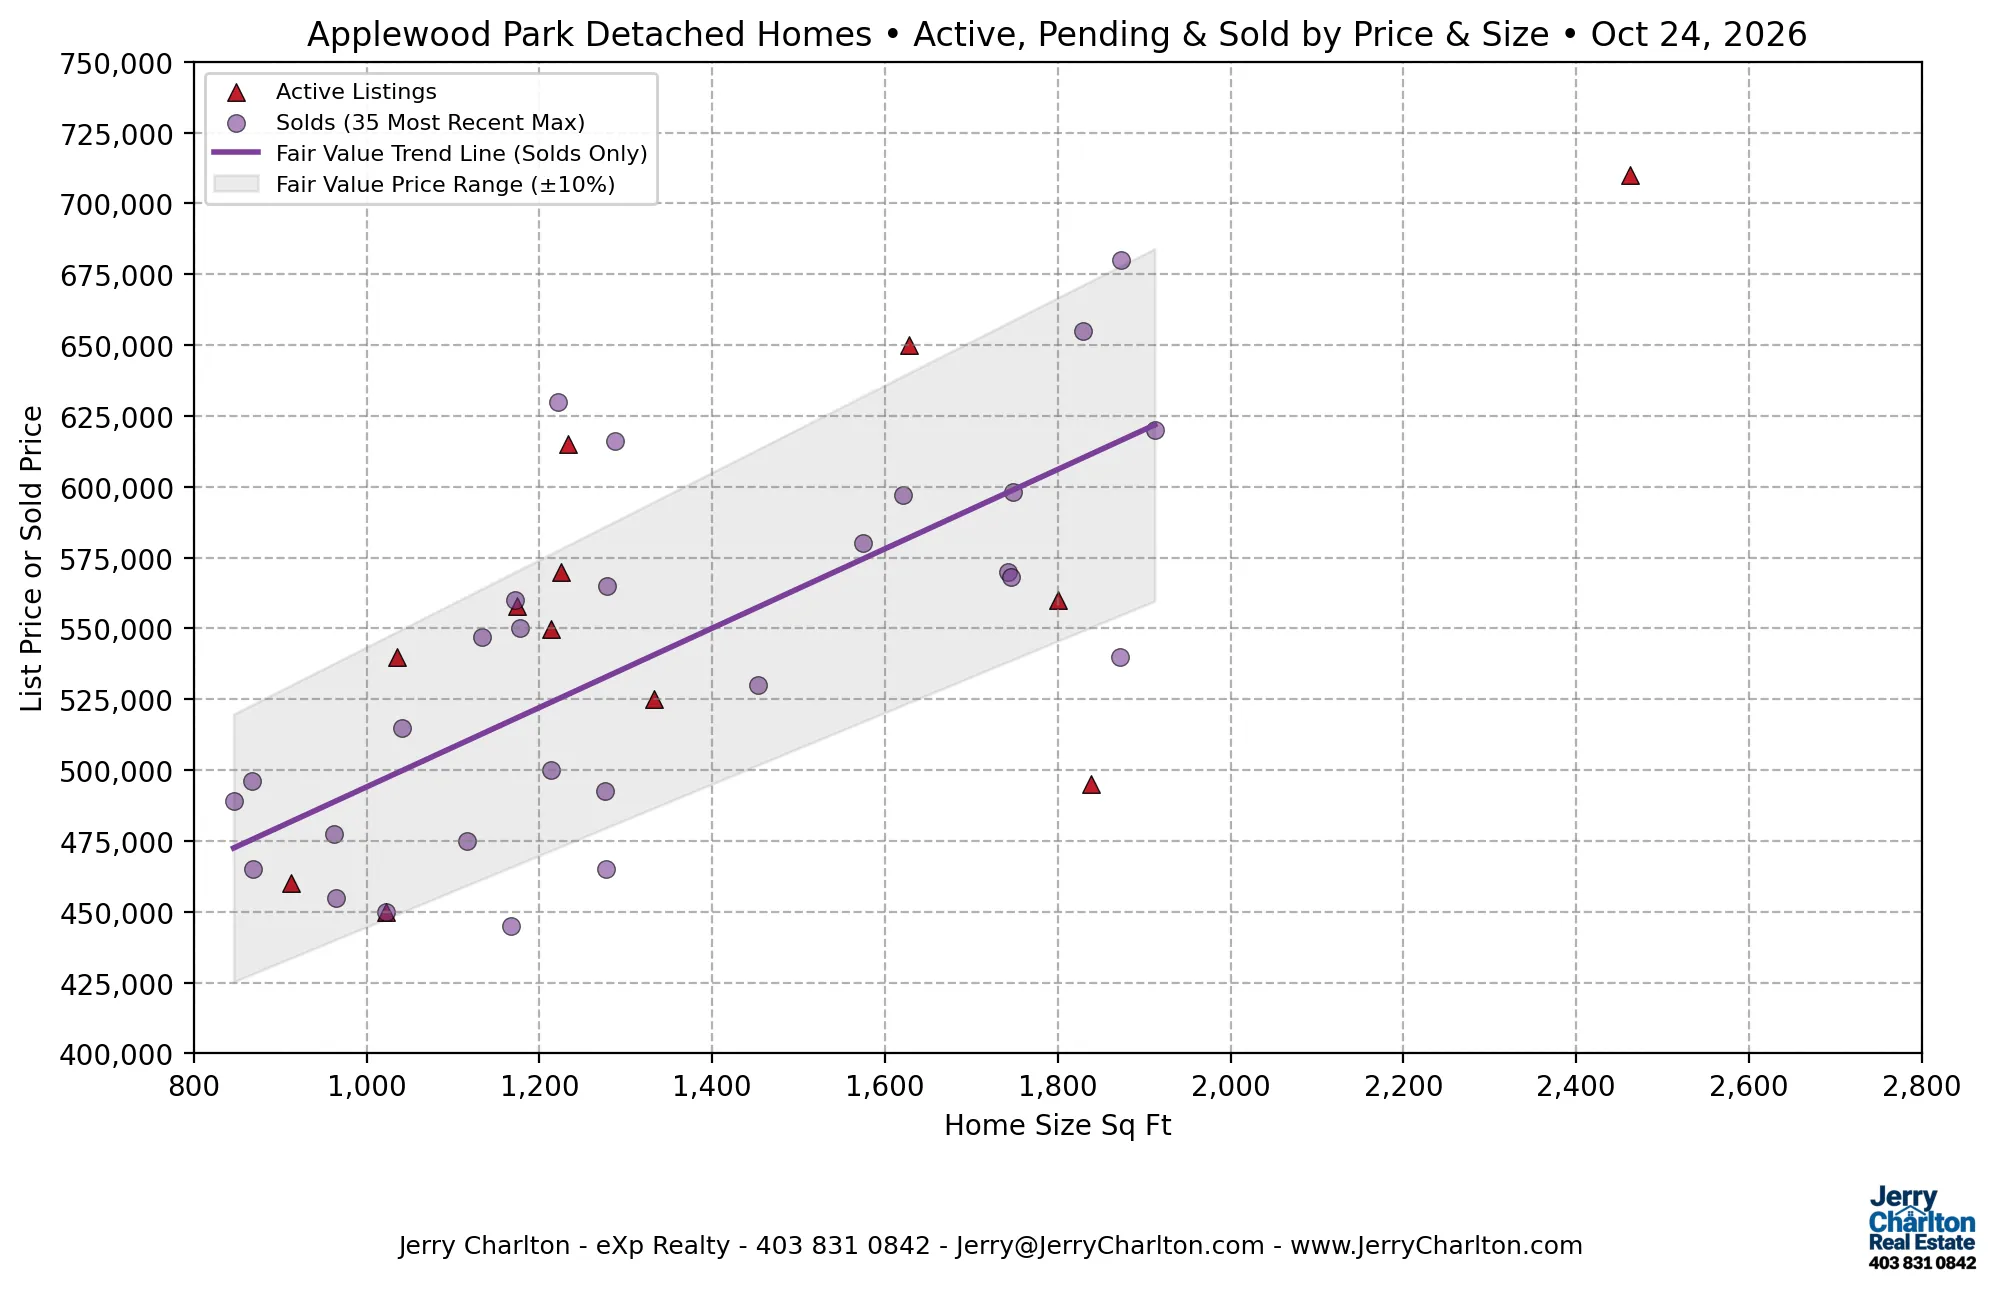
This scatter chart plots active listings, pending sales, and the most recent sold homes by both price and home size. By looking at recent sales we can estimate the current fair value range for homes in Applewood Park.
The purple trend line shows the approximate relationship between home size and market value, while the shaded band represents a typical ±10% fair value range based on the most recent sales.
Homes priced above the band are typically premium properties, often fully renovated or located on larger redevelopment lots. Homes below the band may represent value opportunities for buyers willing to renovate or update.
Applewood Park Home Price History
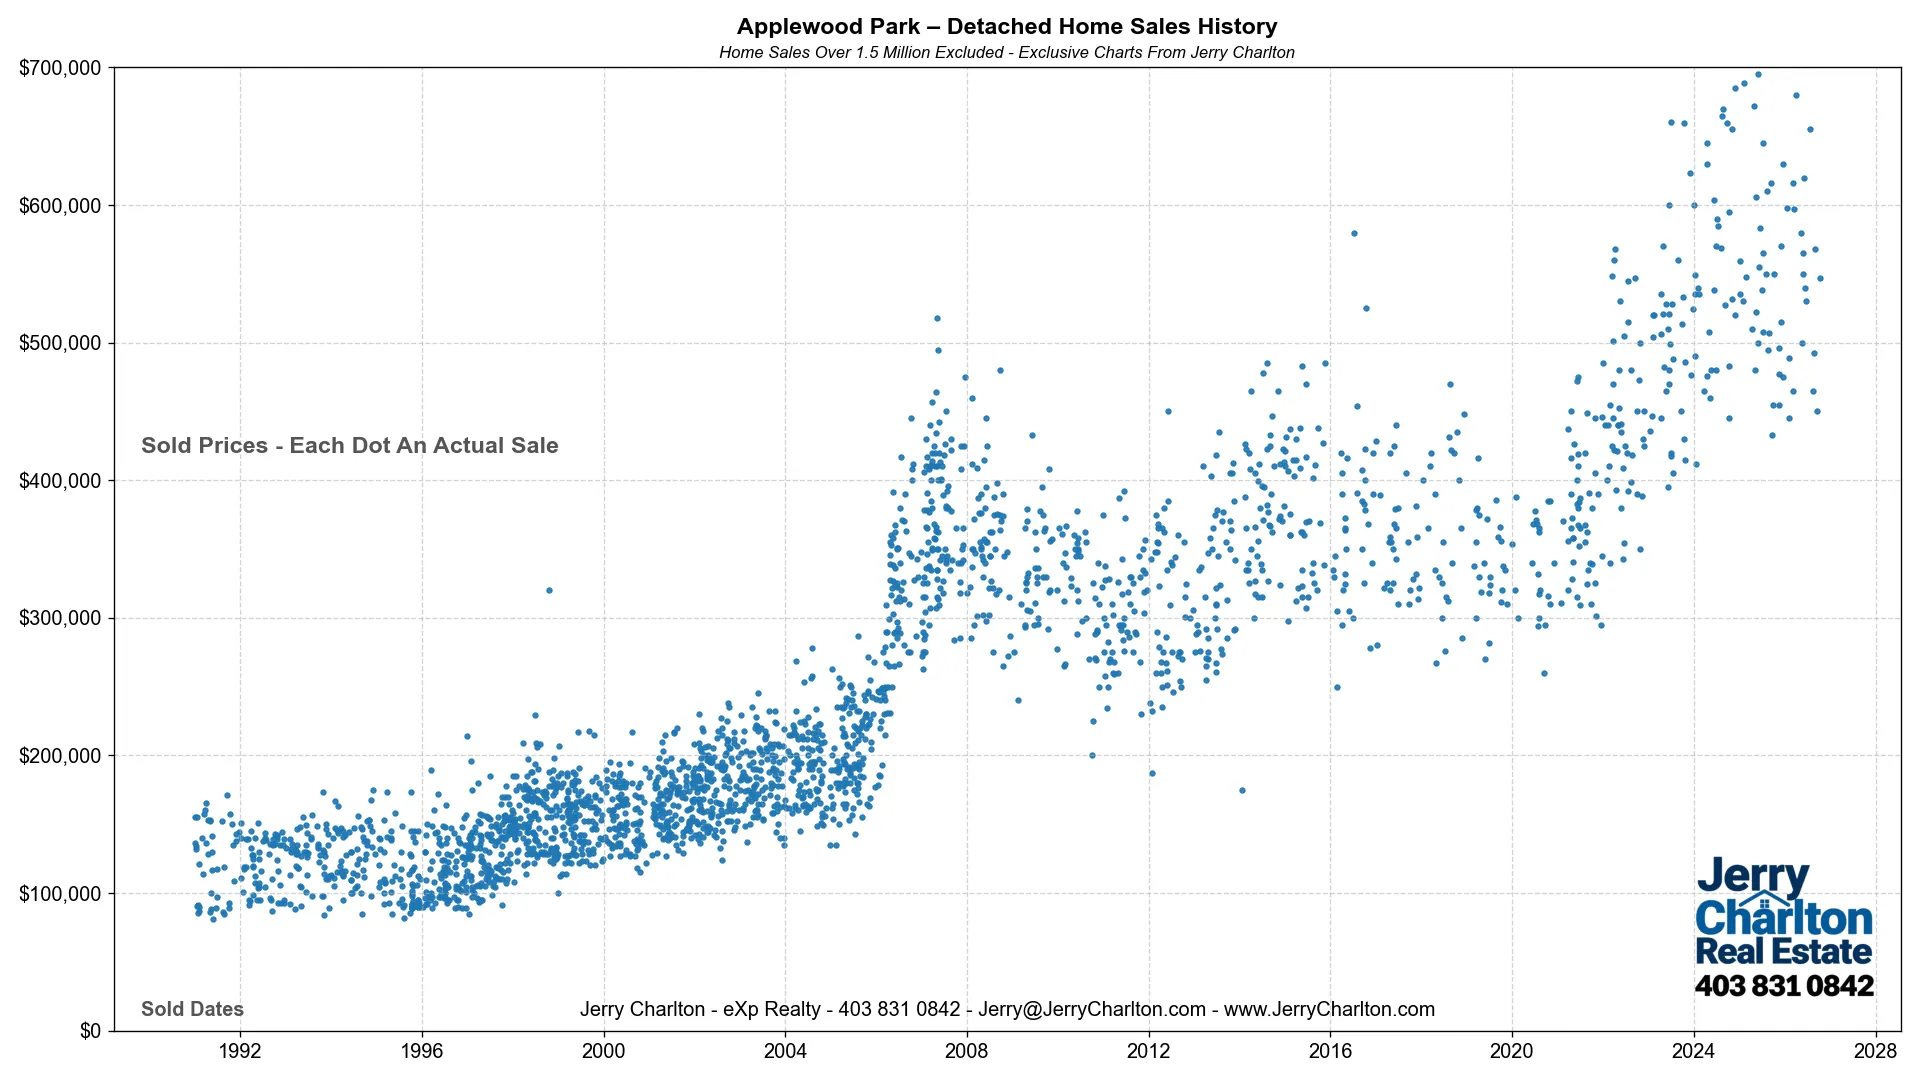
This long-term chart shows how detached home prices in Applewood Park have evolved over time. Each point represents an individual home sale plotted by its sale date and price.
Calgary Community Map — Where is Applewood Park?
See where Applewood Park sits within Calgary and explore surrounding communities. Click the map to view full size.

Current Homes for Sale in Applewood Park
The listings below show homes currently available in Applewood Park. Comparing these listings to recent sales and historical trends can help buyers understand where each property sits within the broader market.
Check Out Nearby Communities
Thinking of selling in Applewood Park?
Community numbers don't price one house. Get a free evaluation based on what's selling in Applewood Park right now.